My Grafana dashboard for monitoring my self hosted cluster.
I made a Grafana Master-dashboard to monitor my Kubernetes cluster.
Features:
Health bar at the top, that will turn amber or red when things go wrong, and send push notifications to my phone
CPU, Memory and Network utilization
Database and Storage backup statuses
I also added CPU/Memory usage request monitoring so that I can tune how much CPU/Memory a pod requests in the cluster.
And active alerts
I’ve muted these two, I need to add a 3rd node with more CPU and ram, currently if one node goes down there isn’t enough redundancy for the cluster to just keep working.
Lots more detail here: https://erasmus.works
It’s all Open-Source, leave a Star on my repo if you like what you see.
#grafana
10 posts · Last used 16d



Replying to
@poes@sok.egois.org @indonesia@fedigroups.social kalo standar industri biasanya pakai #prometheus + #grafana. Tapi kalo mau kayak #librenms, biasanya orang bandingin nya sama #zabbix

Hey, does anyone here consider themselves Good™ at #Grafana and wants to spend like half an hour on a call with me helping me be Good™ for the sake of @civicband@sfba.social ?
I'm trying the @glyph@mastodon.social suggestion of "bug your friends instead of asking AI"

Wanna get #fedihire d for working on #Grafana ?
The community team is looking for a second data scientist. For Reasons(TM), we now call that Senior Machine Learning Engineer 🤷
If that sounds interesting, these are the links for the countries we are looking to hire in:
Canada - https://job-boards.greenhouse.io/grafanalabs/jobs/6121756004
Germany - https://job-boards.greenhouse.io/grafanalabs/jobs/6121947004
Ireland - https://job-boards.greenhouse.io/grafanalabs/jobs/6121948004
Spain - https://job-boards.greenhouse.io/grafanalabs/jobs/6121949004
Sweden - https://job-boards.greenhouse.io/grafanalabs/jobs/6121954004
US - https://job-boards.greenhouse.io/grafanalabs/jobs/6121755004
UK - https://job-boards.greenhouse.io/grafanalabs/jobs/6121956004

Replying to
@tomkindlon@disabled.social @mecfs@fedigroups.social SInce half a year after the first crash, a friend of mine uses the #Garmin Venu 3 with #HR monitoring and HRV and alarms, 'cause he didn't trust his feelngs, just the facts. For pacing essential. Connected it to #influx and #grafana for a deeper view. Tried it with #Apple, but they measure the #HRV not at night, but over the whole day with some #algorithms. Additionially he has the data from 3 yrs. #withings #scanwatch without HRV measurement.
Replying to
@tomkindlon@disabled.social @mecfs@fedigroups.social For the longtime data you can generate a Dashboard in #grafana and put the results in the #AI of your favour for instance claude/gemini. Helps a lot, for behaviour analysys.


New post: Monitoring our FreeBSD Mastodon instance.
burningboard.net runs as a stack of Bastille jails on FreeBSD, so I watch it from a separate box with Prometheus, Grafana and Loki. The interesting part is the FreeBSD-shaped gaps: no native ZFS metrics, nothing for the Mastodon API or our S3 media bucket. A small textfile collector fills all of it.
This is how I keep an eye on the very instance I'm writing this on:
https://blog.hofstede.it/monitoring-a-freebsd-mastodon-instance-with-prometheus-grafana-and-loki/
#FreeBSD #Mastodon #Prometheus #Grafana #SelfHosting
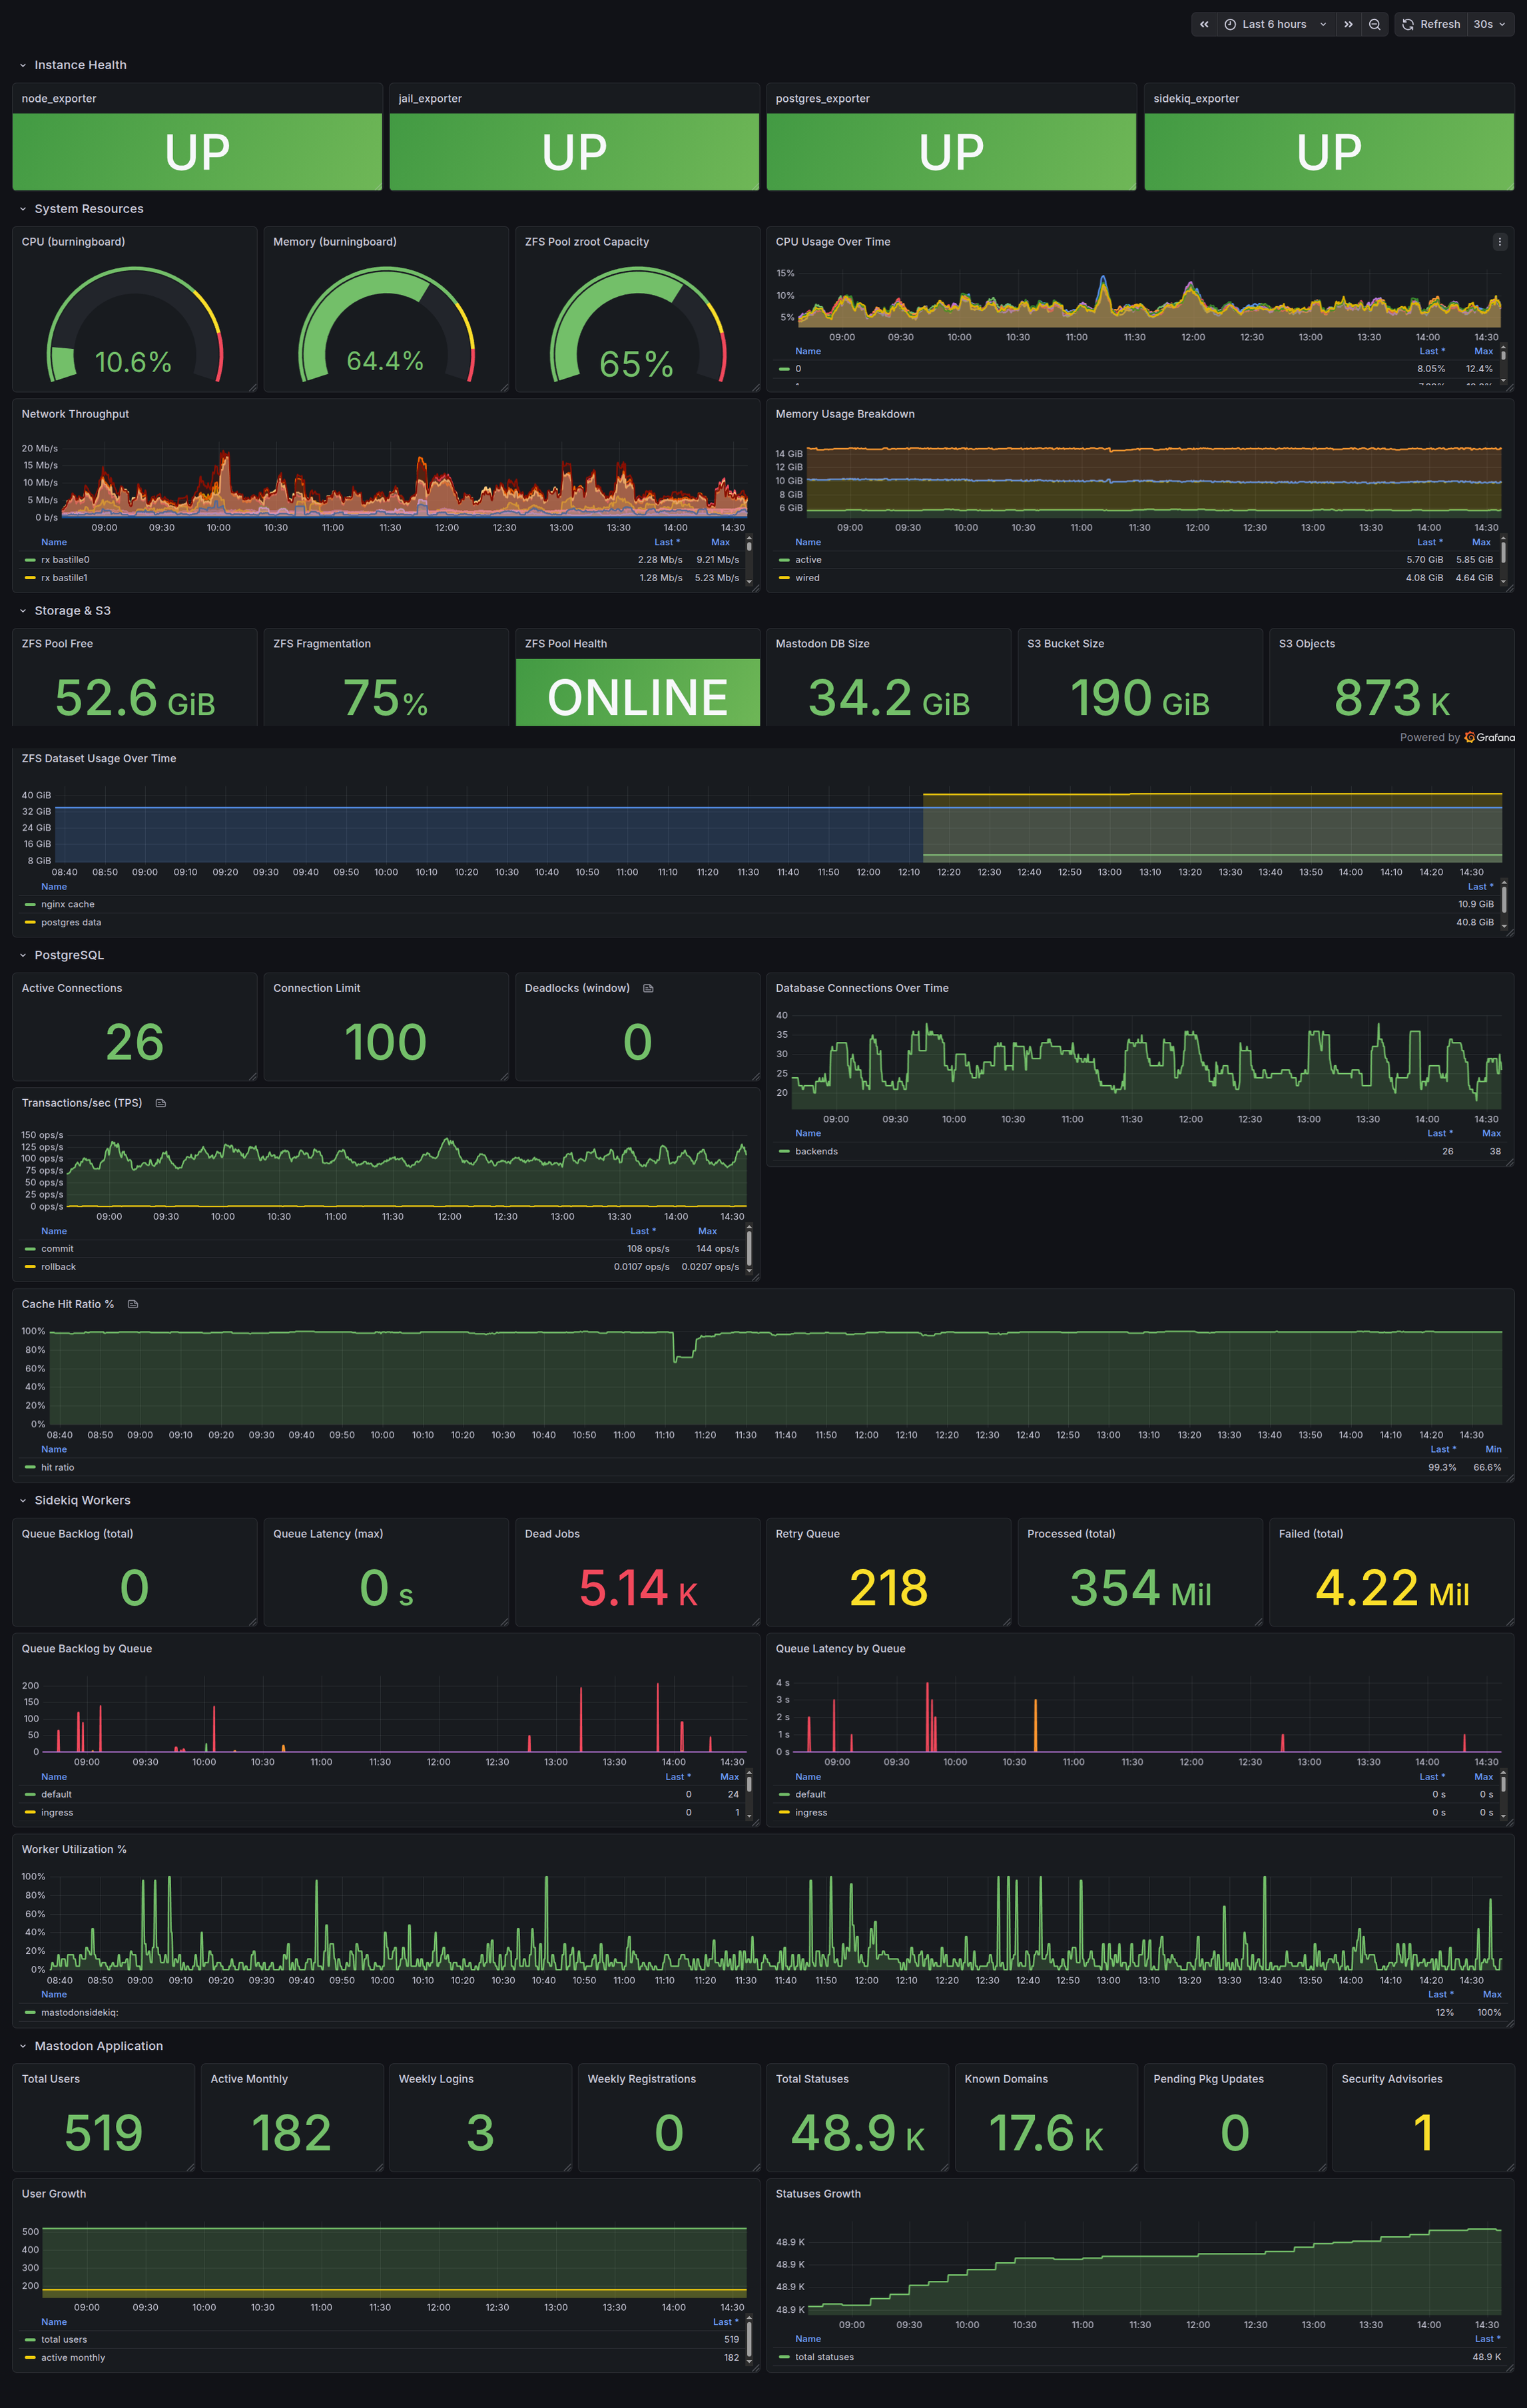
From the engine room: Built a new overview dashboard for our Mastodon instance burningboard.net with all the important stats:
- System overview
- Sidekiq statistics
- Database health
- S3 Bucket utilization
- Mastodon statistics
Starting to look really good and helpful :-)
#mastoadmin #mastodon #freebsd #grafana #monitoring @tux@burningboard.net

I work at #Grafana and persuaded my marketing team to sponsor #emfcamp ... I was speaking to #Antithesis and also persuaded them to sponsor EMF Camp.
Result... EMF Camp have a load of money, and I have more tickets than I need = a good problem.
Antithesis have given me 2 tickets and 1 car park pass to EMF Camp to give away, for free, with zero expectation of anything... also I have maybe 1 spare Grafana sponsor ticket... but how to do this?
Well here's Antithesis https://antithesis.com/ just for FYI, it's like a simulation testing fuzzer... runs your containers and fuzzes them amongst other things. Grafana you already know. That's the entire marketing pitch for both.
Anyone who both boosts and likes this post by 12:00 UTC on Thursday 7th May... those people will be entered into a random draw and I will give those people tickets. If someone does not reply within an hour of me notifying them, I'll move on to the next person, etc until all the tickets I hold are gone.
Yay to EMF Camp https://www.emfcamp.org/ which is July 16th– 19th 2026 in Eastnor, UK.
Filter out #grafithesiscamp to prevent ever seeing this message again if you are not interested.


The next #LightningTalk at #OggCamp was about Self-hosted Observability, using various #Grafana projects and #Prometheus etc.
Alan was using some #YAML files to provision the services via docker etc.
I didn't quite understand it all, but there's a few extra Grafana products I should check out - Alloy and Mimir.
https://github.com/alanionita/observability-stack
#selfhosting #metrics
You've seen all posts